ZOOM SMART CLASSES @8.30PM TO 10PM :Academy’s Life-Time Registration ₹1999/- Now Just ₹999/-Only & MONTHLY CLASS FEE ₹1499 NOW JUST ₹999 ONLY FOR 1st 500 STUDENTS.
BOLLINGER BANDS
INDICATOR
SHAILENDRA SINGH SENGAR
2/13/20251 min read

Bollinger Bands: What They Are and What They Tell Investors
What Are Bollinger Bands?
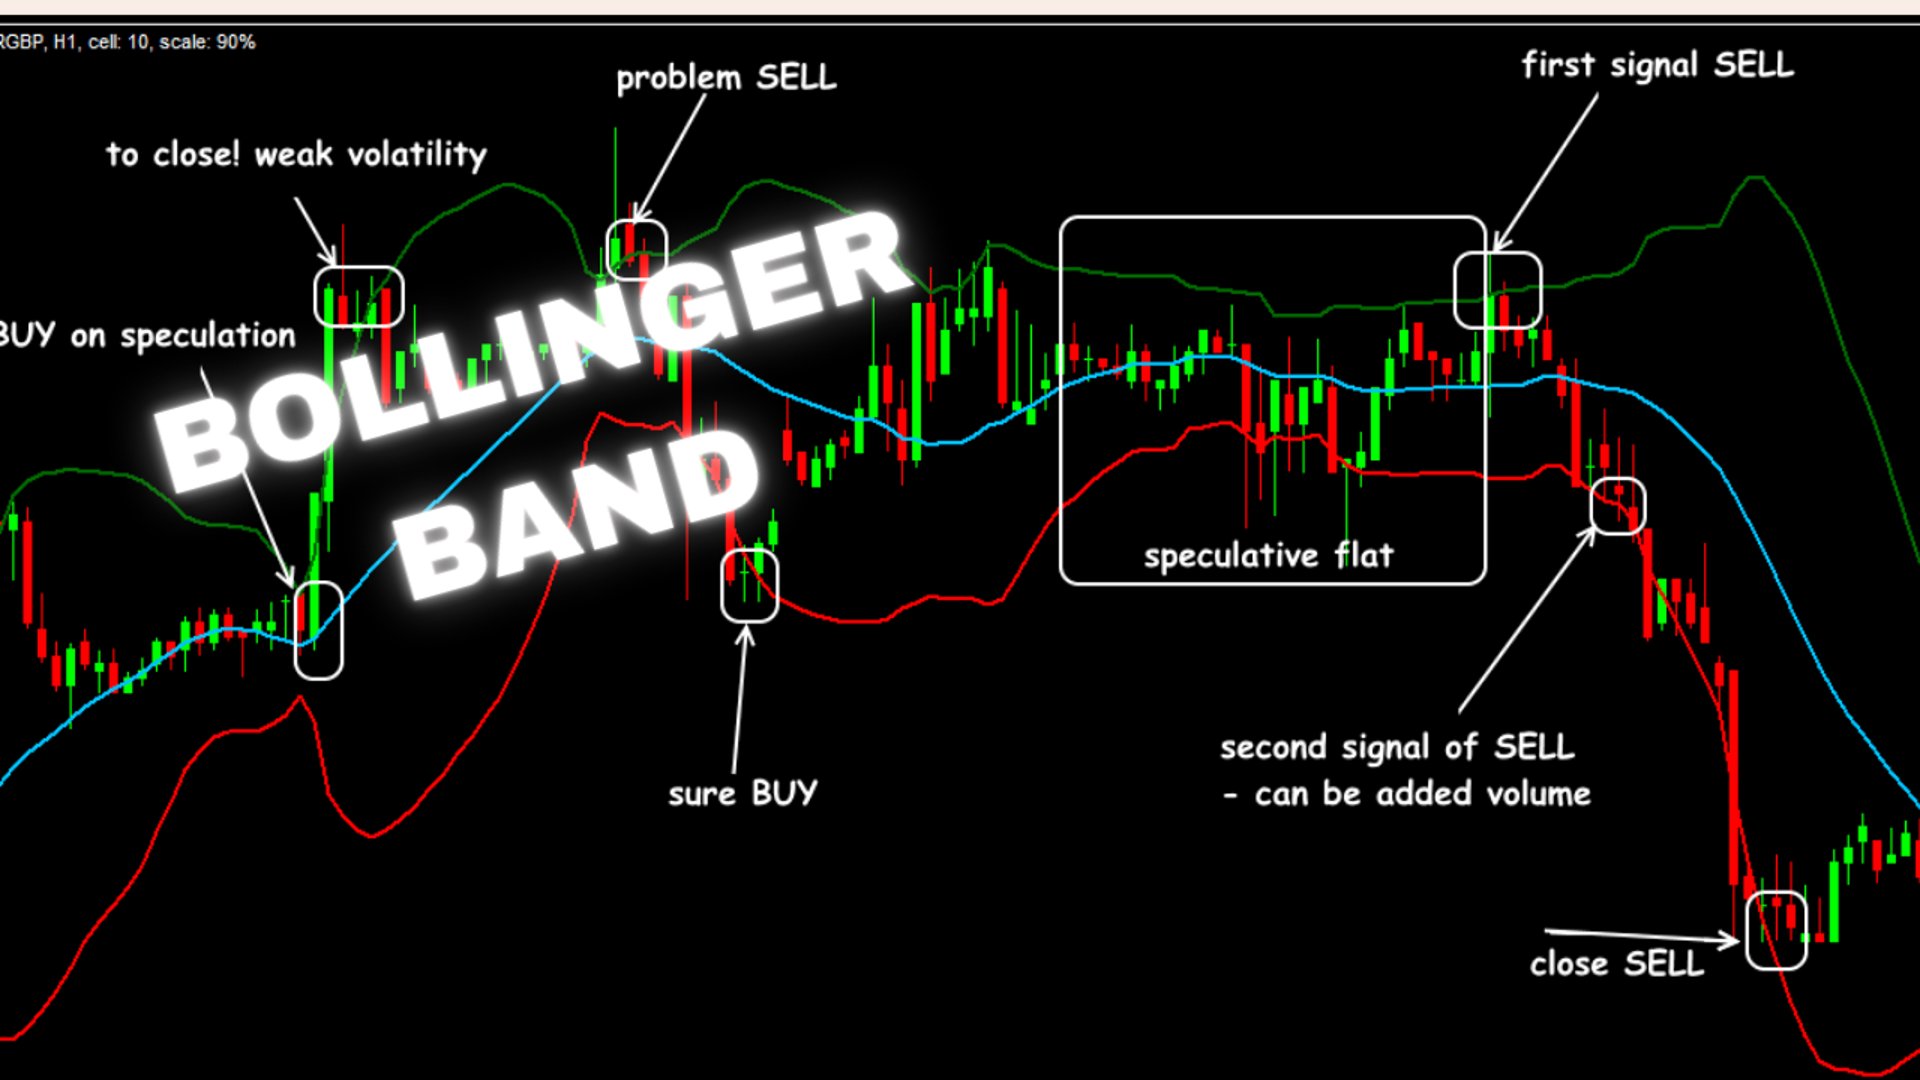
Bollinger Bands are a popular technical indicator used in trading to measure market volatility and identify potential buy or sell signals. They were developed by John Bollinger in the 1980s.
Bollinger Bands consist of three lines:
Middle Band: A 20-day Simple Moving Average (SMA).
Upper Band: The SMA + 2 standard deviations (shows overbought conditions).
Lower Band: The SMA - 2 standard deviations (shows oversold conditions).
What Do Bollinger Bands Tell Investors?
Volatility Indicator:
When the bands expand (widen), volatility is high.
When the bands contract (narrow), volatility is low.
Overbought & Oversold Conditions:
If the price touches the upper band, the asset might be overbought, signaling a potential price drop.
If the price touches the lower band, the asset might be oversold, signaling a potential price rise.
Breakout Signals:
A price breakout above the upper band can indicate an uptrend continuation.
A price drop below the lower band can indicate a downtrend continuation.
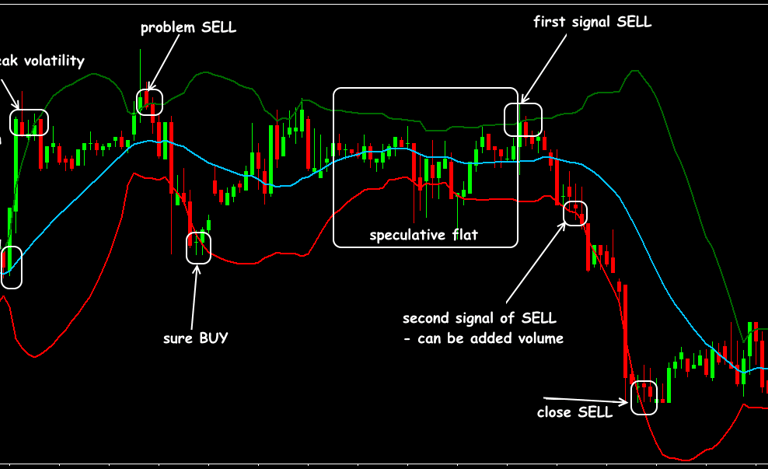
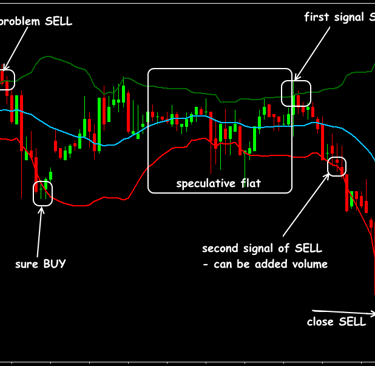
How to Use Bollinger Bands for Trading?
✅ Bollinger Band Squeeze Strategy:
When bands are very close together (squeezed), a big price move is likely coming.
✅ Bollinger Band Bounce Strategy:
The price often "bounces" between the bands, so traders buy near the lower band and sell near the upper band.
✅ Combining with RSI & MACD:
Use RSI (Relative Strength Index) for confirmation of overbought/oversold conditions.
Use MACD (Moving Average Convergence Divergence) to confirm trends before trading.
Conclusion:
Bollinger Bands help traders understand market volatility and potential trade opportunities. However, they should be used along with other indicators to make informed trading decisions.